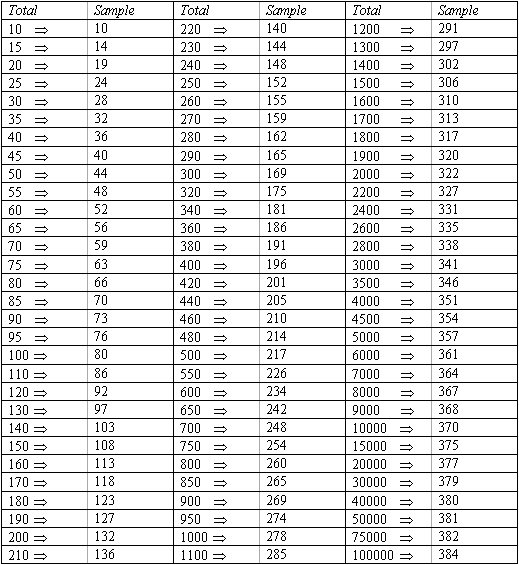
Random Sample
Use the following chart to determine the number of subjects needed to complete the OLA based on the total number in the organization or sub-unit. If this level of “Critical Mass” is reached, then the OLA report can be considered a fair representation of an adequate description of organizational perception.
In addition to reaching this “critical mass” for the total organization you also will want to make sure that there is a fair distribution between the various sub-units of the organization. This allows you to have the broad representation you are seeking.
In seeking to avoid sampling bias work through the following questions:
- Do I have critical mass at the organizational level?
- Do I also have critical mass at the sub-unit level?
- Who, or what group in our organization, was missed?
- What effect will that have?
- Do I need to address this gap through other means? (i.e. interviews)
Find your total organization number on the left column and match it to the recommended sample size to confirm your critical mass number.
 “Table for determining needed size S of a randomly chosen sample from a given finite population of N cases such that the sample proportion p will be within ± .05 of the population proportion P with a 95 percent level of confidence”– Krejcie, R.V., & Morgan, D.W. (1970). Determining sample size for research activities. Educational and Psychological Measurement, 30, 607-610.
